
Embedding Predictive Attrition Scores into HR Workflows: Guide for HRIS and IT Teams
Introduction: Why Predictive Attrition Matters Unplanned employee turnover costs organizations between 50% and 200% of an employee’s annual salary when accounting for recruitment, onboarding, lost productivity, and knowledge transfer. For large enterprises managing thousands of employees across multiple geographies and departments, the financial impact of attrition becomes a critical business concern that demands proactive intervention. Predictive attrition scoring represents a fundamental shift in how HR and people analytics teams approach talent retention. Rather than reacting to resignations after they occur, organizations can now identify flight risks months in advance, enabling targeted retention interventions before employees make final decisions. This shift from reactive to predictive requires a coordinated effort between HR leaders, HRIS administrators, IT infrastructure teams, and data engineers. The challenge, however, extends beyond simply building a statistical model. Organizations must integrate predictive scores seamlessly into existing HR workflows, ensure data quality and governance, maintain privacy and security standards, and drive adoption across multiple stakeholder groups. This comprehensive guide walks HRIS and IT teams through each phase of this journey, providing practical frameworks and technical considerations. Understanding Predictive Attrition Scoring What Is Predictive Attrition Scoring? Predictive attrition scoring uses machine learning algorithms to assign a numerical score or probability to each employee representing their likelihood of leaving the organization within a defined time horizon, typically 3 to 12 months. These scores are derived from historical employee data, including tenure, compensation, performance ratings, promotion history, engagement survey responses, and organizational factors such as department, manager, and location. Unlike traditional turnover analysis, which answers the question “Who left and why?”, predictive scoring answers “Who is likely to leave and when?” This forward-looking capability transforms retention from a historical audit function into a strategic business process. Key Metrics and Dimensions Effective attrition prediction models incorporate multiple data dimensions: Individual Performance Factors: Performance ratings, promotion history, skill assessments, and training completion rates provide signals about career satisfaction and growth trajectory. Employees who have plateaued or received declining performance ratings may be more likely to seek external opportunities. Compensation and Benefits Alignment: Salary progression relative to market rates, bonus consistency, and benefits utilization indicate whether compensation packages remain competitive. Significant gaps between internal pay equity and external market rates often precede departures. Engagement and Sentiment Indicators: Engagement survey scores, pulse survey responses, internal mobility interest, and manager feedback capture emotional and cultural dimensions of the employment relationship. Declining engagement often signals early warning signs of departure intent. Tenure and Career Progression: Tenure milestones, years since last promotion, and internal movement patterns reveal career momentum. Employees at critical tenure points (2-3 years, 5 years) or those in stalled career paths face higher attrition risk. Organizational and Manager Context: Department, reporting manager, team size, and organizational changes influence retention. Employees under specific managers or in high-turnover departments may face elevated risk regardless of individual factors. Prediction Time Horizons Organizations typically establish prediction windows of 3, 6, 9, or 12 months. Shorter windows (3 months) capture imminent departures with high precision, while longer windows (12 months) enable more proactive interventions. Many organizations maintain multiple models with different time horizons to support both immediate action and strategic planning. Data Foundation and Integration Requirements Identifying Required Data Sources Building robust attrition predictions requires integrating data from multiple systems within your HR technology stack. The foundational data sources include: HRIS Core Data: Employee demographics, employment status, hire dates, termination dates, job titles, organizational hierarchy, and location information form the backbone of any attrition model. This data typically resides in your primary HRIS system, whether that’s Workday, SAP SuccessFactors, BambooHR, or another platform. Payroll and Compensation Data: Salary history, bonus payments, equity grants, benefits enrollment, and compensation changes provide critical signals about career progression and financial satisfaction. This data often lives in separate payroll systems that must be integrated with HRIS records. Performance Management Systems: Performance ratings, review dates, promotion history, and development feedback from systems like Lattice, 15Five, or native HRIS modules offer insight into career trajectory and engagement. Learning and Development Platforms: Training completion, course enrollment, skill certifications, and learning path progression from platforms such as LinkedIn Learning, Coursera, or internal LMS systems indicate investment in employee development and career growth. Engagement and Survey Data: Employee engagement survey scores, pulse survey responses, eNPS (employee Net Promoter Score), and manager feedback from tools like Culture Amp, Officevibe, or Qualtrics capture sentiment and satisfaction dimensions. Absence and Wellness Data: Sick leave patterns, absences, wellness program participation, and health insurance claims can correlate with satisfaction and burnout indicators. Business Operations Data: Revenue, headcount, department performance, and organizational changes from financial systems provide context for departmental and role-level attrition patterns. For organizations using Agile HR Analytics, the platform’s pre-built data models and connectors streamline integration of these disparate sources while maintaining data quality and governance standards. Data Quality and Governance Framework Predictive accuracy depends entirely on data quality. Implement a comprehensive data governance framework before building models: Data Validation Rules: Establish automated validation to catch missing values, inconsistent formats, and logical errors. For example, termination dates should never precede hire dates, and salary changes should follow logical progression patterns. Regular validation audits should be scheduled monthly or quarterly. Data Lineage and Documentation: Document where each data element originates, how it transforms, and how it feeds into models. This documentation proves essential for audit trails, regulatory compliance, and troubleshooting model performance issues. Data Completeness Thresholds: Define minimum acceptable levels of data completeness for model inputs. If a critical field is missing for more than 15% of records, either improve data collection or adjust model logic to handle missing values appropriately. Historical Data Retention: Maintain at least 3-5 years of historical data to capture seasonal patterns, economic cycles, and organizational changes. Longer historical periods improve model stability and reduce false positives from anomalous years. Access Controls and Audit Logs: Implement role-based access controls (RBAC) to ensure only authorized personnel access sensitive employee data. Maintain comprehensive audit logs of who accessed what data and when, supporting both compliance requirements and security investigations. Data Integration Architecture
Effective Survey Analytics: Turning Employee Feedback into Actionable HR Insights with Power BI
Introduction to Survey Analytics {#introduction} Employee feedback has become one of the most valuable assets in modern human resources. Yet many organizations struggle to extract meaningful insights from the surveys they conduct. The challenge isn’t collecting feedback anymore; it’s transforming that feedback into decisions that drive real business outcomes. Survey analytics represents the intersection of data science, HR strategy, and organizational psychology. It’s the process of systematically collecting, analyzing, and acting on employee feedback to improve workplace culture, engagement, retention, and performance. When done effectively, survey analytics can reveal patterns that leaders might otherwise miss, identify flight risks before they leave, and pinpoint exactly where to invest in employee experience improvements. The stakes are high. According to research on how to turn employee feedback into actionable HR insights, organizations that systematically act on employee feedback see measurable improvements in retention, productivity, and financial performance. However, the gap between collecting feedback and acting on it remains significant in many enterprises. This comprehensive guide explores how to build an effective survey analytics program using modern tools and methodologies. We’ll cover everything from survey design and data collection through advanced analytics and closed-loop action planning. By the end, you’ll understand how to leverage platforms like Power BI alongside AI-powered tools to turn employee feedback into strategic decisions that transform your organization. Understanding the Survey Analytics Landscape {#landscape} The Evolution of Employee Feedback Employee feedback mechanisms have evolved dramatically over the past decade. Traditional annual engagement surveys, once the gold standard, have given way to more frequent pulse surveys, real-time feedback mechanisms, and continuous listening strategies. This shift reflects a fundamental change in how organizations view employee voice: not as an annual event, but as an ongoing conversation. The modern survey analytics landscape includes multiple feedback channels. Employees now provide input through formal surveys, pulse checks, focus groups, one-on-one conversations, performance reviews, exit interviews, and informal channels like Slack or Teams. The challenge for HR leaders is integrating all these data streams into a coherent picture. According to the science of employee feedback research, the most effective organizations treat feedback as a scientific process. They design surveys based on established psychological principles, use rigorous statistical methods to analyze results, and create feedback loops that demonstrate how input leads to change. Why Survey Analytics Matters Now In today’s competitive talent market, survey analytics has moved from a nice-to-have HR function to a business-critical capability. Several factors drive this shift: Retention and Attrition Prevention: Survey data often reveals warning signs of disengagement months before an employee leaves. By analyzing patterns in feedback, HR teams can identify at-risk employees and intervene proactively. Diversity, Equity, and Inclusion: Survey analytics enables organizations to understand how different employee populations experience the workplace. This data is essential for building truly inclusive cultures and identifying systemic barriers. Remote and Hybrid Work: As workforces become distributed, surveys become a critical mechanism for maintaining connection and understanding employee sentiment across locations. Data-Driven Decision Making: HR leaders increasingly need to justify investments in programs and policies with data. Survey analytics provides the evidence base for strategic decisions. Regulatory Compliance: Organizations in regulated industries need to demonstrate compliance with employment laws and regulations. Survey data can provide evidence of fair treatment and equal opportunity. The Role of Technology in Survey Analytics Modern survey analytics requires the right technological foundation. The best platforms integrate several key capabilities: Data Collection: Tools that make it easy for employees to provide feedback across multiple channels and devices. Data Integration: Systems that can combine survey data with HR systems, payroll data, performance management systems, and business metrics. Analytics and Visualization: Platforms that can surface patterns, trends, and anomalies in complex feedback datasets. AI and Machine Learning: Advanced tools that can identify sentiment, predict outcomes, and surface actionable insights automatically. Action Management: Systems that track what actions were taken in response to feedback and measure their impact. Agile HR Analytics exemplifies this integrated approach, combining Power BI dashboards with AI-powered insights to help organizations move from feedback collection to decision-making efficiently. Designing Surveys for Maximum Insight {#designing} Survey Design Principles Effective survey analytics starts with effective survey design. A poorly designed survey will generate data that’s difficult to analyze and unlikely to drive action. The best surveys are built on several key principles: Clarity and Simplicity: Questions should be unambiguous and easy to understand. Avoid jargon, double negatives, and questions that ask about multiple things at once. Relevance: Every question should serve a clear purpose. If you can’t articulate why you’re asking a question and how you’ll use the answer, don’t include it. Actionability: Survey questions should be designed to surface insights that leaders can actually act on. Questions about specific experiences or conditions are more actionable than vague questions about overall satisfaction. Consistency: Use consistent rating scales and response formats throughout the survey. This makes analysis easier and reduces confusion for respondents. Brevity: Longer surveys have lower completion rates. Aim for surveys that take 5-10 minutes to complete, depending on the frequency. Question Types and Formats Different question types serve different purposes in survey analytics: Likert Scale Questions: The most common format in employee surveys, Likert scales typically ask respondents to rate agreement or frequency on a scale (e.g., 1-5 or 1-7). These questions are easy to analyze and provide quantitative data. Net Promoter Score (NPS): A single question asking how likely employees are to recommend the organization as a place to work. NPS is simple to calculate and track over time. Open-Ended Questions: Text responses that capture qualitative feedback. These are harder to analyze at scale but provide rich context and can reveal unexpected insights. Multiple Choice: Questions with predefined response options. Useful for demographic information and categorical data. Matrix Questions: Multiple related questions using the same scale. Efficient for covering multiple aspects of a topic. The most effective surveys blend quantitative and qualitative approaches. Quantitative data provides the breadth and statistical power; qualitative data provides depth and context. Survey Frequency and Timing How often should you survey
Fast-Track Deployment: Using Pre-built Data Models to Launch People Analytics in 30 Days
Introduction: The Speed Imperative in People Analytics In today’s competitive talent landscape, organizations cannot afford to wait six months or longer to gain visibility into their workforce. The cost of delayed insights is measured not just in missed opportunities, but in attrition, disengagement, and suboptimal talent decisions. Yet many enterprises embarking on people analytics initiatives find themselves trapped in lengthy implementation cycles, wrestling with data integration complexities, and struggling to demonstrate value before stakeholder patience runs out. The traditional approach to HR analytics deployment has been methodical and slow. Organizations would spend months defining requirements, designing data models from scratch, integrating disparate HR systems, and building dashboards piece by piece. While this approach ensured thoroughness, it also meant that critical workforce insights remained locked away in siloed systems, unavailable to the leaders who needed them most. There is a better way. By leveraging pre-built data models specifically designed for HR and people analytics, organizations can compress deployment timelines from six months to just 30 days. This isn’t about cutting corners or sacrificing rigor; it’s about standing on the shoulders of proven frameworks that have already solved the core data modeling challenges that plague HR analytics projects. Agile HR Analytics (AHA!) has pioneered this fast-track approach, enabling enterprises to launch comprehensive people analytics capabilities in a single month. The secret lies in combining three critical elements: standardized, pre-built data models that eliminate the need to design schemas from scratch; seamless integration with existing HR, payroll, and business systems; and AI-powered assistants that transform raw data into immediately actionable insights. This guide walks you through the complete 30-day deployment journey. Whether you’re a CHRO evaluating your analytics strategy, an HR data team preparing for implementation, or an IT leader assessing technical requirements, you’ll discover how to accelerate your people analytics timeline while maintaining the security, governance, and compliance standards your organization demands. Understanding Pre-Built Data Models and Their Value What Are Pre-Built Data Models? A data model is the structural blueprint that defines how data is organized, stored, and related within a system. For people analytics, it specifies which HR entities (employees, departments, roles, compensation) exist, what attributes describe them (hire date, salary, performance rating), and how they connect to one another (an employee belongs to a department, which reports to a business unit). Building a data model from scratch requires deep expertise in database design, HR data semantics, and analytics best practices. You must identify all relevant entities, normalize relationships to avoid data redundancy, and ensure the structure supports both operational reporting and advanced analytics. This process typically consumes 4-8 weeks of a skilled data engineer’s time, even for organizations with straightforward HR systems. Pre-built data models short-circuit this phase entirely. They are templates or frameworks developed by HR analytics specialists based on years of experience across hundreds of implementations. They already account for standard HR entities (employees, jobs, compensation, performance, engagement, attrition), common relationships, and proven structures that support everything from basic headcount reporting to sophisticated predictive analytics. The value proposition is compelling. According to research on how to use pre-built models for people analytics at scale, organizations using standardized templates accelerate time-to-insight by 60-70% while reducing data modeling errors by up to 80%. Rather than designing your own schema, you adapt a proven template to your specific needs, a process that takes days rather than weeks. Why Speed Matters in People Analytics The business case for rapid deployment extends beyond simply getting faster answers. In a dynamic labor market, delayed insights translate directly into business impact. If attrition prediction models take six months to deploy, you’ve already lost 15-20% of your workforce before you can act. If pay equity analysis lags by months, you’re exposed to compliance risks and reputational damage. Furthermore, organizational momentum is finite. Executives who green-light analytics initiatives expect to see results within a reasonable timeframe. If your implementation stretches beyond a quarter, stakeholder enthusiasm wanes, budget priorities shift, and the project risks becoming another stalled IT initiative. Rapid deployment maintains executive engagement, builds confidence in the analytics function, and creates a foundation for ongoing expansion. Pre-built models also democratize people analytics. Rather than requiring a team of specialized data scientists and database architects, you can launch a robust analytics platform with your existing HR and BI talent. This reduces dependency on scarce technical resources and makes the project more feasible for mid-market and smaller enterprises. The Agile HR Analytics Approach Agile HR Analytics has embedded pre-built data models directly into its platform, available through Agile HR Analytics. These models span the full spectrum of HR analytics use cases: workforce composition and planning, compensation and pay equity, talent management and development, engagement and retention, and recruiting analytics. The models are built on Microsoft Power BI and Azure, leveraging enterprise-grade infrastructure while maintaining flexibility for customization. The platform includes more than just templates. The AI assistant, XAHA, interprets your data and generates insights without requiring users to write complex queries or formulas. This means your HR business partners can ask natural-language questions (“What’s driving attrition in engineering?”) and receive instant, data-backed answers. Combined with pre-built dashboards that visualize key metrics out of the box, the platform eliminates the typical lag between data availability and insight generation. The 30-Day Deployment Framework Week 1: Assess, Plan, and Mobilize The first week is critical for setting the stage. Your goal is to understand the current state, define success criteria, and establish the deployment team and governance structure. Days 1-2: Discovery and Assessment Begin by inventorying your HR data sources. Most enterprises rely on multiple systems: a primary HRIS (SAP SuccessFactors, Workday, ADP), a payroll system (often separate from HRIS), survey platforms for engagement data, and various business systems (finance, operations) that contain relevant workforce context. Document each system, its data quality, update frequency, and access permissions. Simultaneously, identify your key stakeholders and their analytics needs. Meet with CHROs, talent leaders, compensation managers, and business unit heads to understand their top three questions about the workforce. These become your
Implementing XAHA: Step-by-Step Guide to Integrating an AI-Powered HR Assistant with Power BI
Introduction The modern HR landscape demands speed, precision, and actionable intelligence. Organizations across industries are recognizing that traditional HR analytics approaches can no longer keep pace with the complexity of workforce management, pay equity analysis, attrition prediction, and strategic talent planning. This is where AI-powered HR assistants transform the equation. XAHA, the AI assistant from Agile HR Analytics, represents a paradigm shift in how HR leaders and analytics teams extract value from their data. Built on the Microsoft stack including Power BI, Azure, and Azure OpenAI, XAHA enables organizations to move from reactive reporting to proactive, AI-driven decision-making. Whether you’re a Chief Human Resources Officer (CHRO) evaluating enterprise solutions, an HR analytics team seeking faster insights, or an IT team managing Microsoft infrastructure, this comprehensive guide will walk you through every step of implementing XAHA successfully. The integration of AI into human resource management has become increasingly critical. Research from the NIH demonstrates how AI algorithms are automating recruitment, resume screening, and initial interviews in HR management, while IBM’s authoritative guide emphasizes the importance of establishing AI vision, data governance, infrastructure planning, and cultural transformation for HR AI integration. Organizations that successfully implement AI-powered HR solutions gain competitive advantages in talent acquisition, employee retention, and strategic workforce planning. This guide provides the practical, technical, and strategic insights you need to implement XAHA effectively, whether you’re deploying on cloud infrastructure or maintaining local hosting for regulatory compliance. Understanding XAHA and Its Role in HR Analytics What Is XAHA? XAHA is Agile HR Analytics’ intelligent AI assistant, purpose-built to accelerate HR decision-making by transforming complex HR data into clear, actionable insights. Unlike generic AI tools, XAHA is specifically trained to understand HR metrics, workforce dynamics, compensation structures, and people analytics workflows. The assistant leverages Azure OpenAI capabilities to process natural language queries about your workforce, generate insights from pre-built data models, and deliver context-aware recommendations. When an HR leader asks “What is driving attrition in our engineering department?” or “How do our pay equity metrics compare across regions?”, XAHA doesn’t just return data points. It synthesizes information across multiple data sources, applies HR-specific logic, and presents findings in business-friendly language. How XAHA Integrates with Power BI XAHA’s integration with Power BI creates a unified analytics ecosystem. Power BI serves as the visualization and reporting layer, while XAHA provides the conversational intelligence layer. This dual approach means: Dashboards remain your source of truth for structured reporting and KPI tracking XAHA enables ad-hoc analysis without requiring users to build custom Power BI queries Both tools work together to serve different analytical needs and user skill levels Data consistency is maintained across both interfaces, as they pull from the same underlying data models This architecture is particularly valuable in regulated industries where audit trails, data governance, and role-based access control are non-negotiable. According to Gartner’s research on implementing AI in HR, vendor selection and risk mitigation are critical for HR leaders, and XAHA’s integration with enterprise Microsoft tools addresses these concerns directly. Key Capabilities XAHA Unlocks When properly implemented, XAHA enables: Rapid insight discovery through natural language queries instead of manual dashboard navigation Pay equity analysis at scale, identifying compensation gaps across demographics and roles Attrition prediction using historical patterns and current workforce signals Workforce planning scenarios based on headcount trends and skill requirements Compliance reporting with full audit trails and role-based data access Employee experience insights by synthesizing survey data, engagement metrics, and retention signals Deloitte’s global survey on AI adoption in HR reveals trends in automation, skills gaps, and ROI for HR technology investments, showing that organizations implementing AI-powered HR solutions see measurable improvements in decision velocity and strategic alignment. Pre-Implementation Planning and Assessment Stakeholder Alignment and Governance Before deploying XAHA, establish clear governance and stakeholder alignment. This implementation will touch multiple departments and require coordination across HR, IT, data engineering, and potentially compliance teams. Key stakeholders to engage: CHRO or VP of Human Resources: Sets strategic direction and defines use cases HR Analytics and Insights team: Owns data quality, model refinement, and ongoing optimization HRIS and payroll teams: Ensures data accuracy and completeness IT and Security teams: Manages infrastructure, access controls, and compliance Data Engineering team: Handles data pipeline development and integration Compliance and Legal: Reviews data governance, privacy, and regulatory requirements Create a steering committee that meets monthly during implementation to track progress, address blockers, and adjust priorities. Define clear decision rights so that questions about data access, feature prioritization, and resource allocation can be resolved quickly. Defining Your Use Cases XAHA’s value multiplies when you start with clear, high-impact use cases. Rather than implementing the tool and hoping people will find value, reverse the process. Begin with business problems you need to solve. High-impact use cases for XAHA implementation: Pay equity analysis: Identify and remediate compensation gaps across protected classes and job families Attrition prediction: Identify flight risks and understand drivers of voluntary turnover Workforce planning: Project headcount needs, skill gaps, and succession pipeline strength Diversity and inclusion metrics: Track progress toward D&I goals and identify underrepresented populations Employee experience analysis: Correlate engagement survey responses with retention outcomes Recruitment analytics: Understand time-to-hire, cost-per-hire, and quality-of-hire by source Learning and development ROI: Track training completion, skill development, and career progression For each use case, document the business question, the data sources required, the frequency of analysis, and the stakeholders who need the insights. This clarity will guide your data integration and model development work. Data Readiness Assessment XAHA’s effectiveness depends entirely on data quality. Before implementation, conduct a comprehensive data readiness assessment. Evaluate your current state across: Data completeness: Are critical fields populated across your HRIS, payroll, and survey systems? What is your data completion rate for fields like job family, compensation, start date, and manager hierarchy? Data accuracy: How frequently is data updated? Are there known data quality issues or reconciliation gaps? Data consistency: Do employee IDs match across systems? Are there duplicate records or conflicting information? Historical data: Do you have sufficient historical data to train predictive models?

People Analytics You Can Count On
Every HR leader has heard the jargon by now, workforce reporting, people analytics, workforce intelligence. Different vendors give it different names, but as AHA’s Chief Revenue Officer Bruce Chadburn puts it, “generally, it means the same thing.” Organisations have already invested heavily in HCM suites that capture the transactional data needed to manage a workforce. The real opportunity isn’t finding a new label for that data, it’s finally getting a return on it. We sat down with Bruce, who’s spent more than 20 years in this space, to cut through the noise and talk about what’s actually holding organisations back from building real people analytics capability, and where AHA fits into that picture. Don’t get caught up in the vendor talk Bruce’s advice for HR leaders trying to make sense of the market is refreshingly simple: don’t overthink the terminology. Whether a vendor calls it people analytics or workforce intelligence, the goal is the same, pull transaction data out of the systems already in place and turn it into information that supports better decisions, now and into the future. Getting distracted by shifting vendor language is, in his words, a distraction from the work that actually matters. The biggest challenge isn’t the data – it’s the divide Organisations today are capturing more workforce data than ever before, and that’s a good thing. But according to Bruce, the volume of data isn’t what typically holds capability back. Nor is the choice of underlying system. The challenge that goes largely unspoken in this industry is far more human: the internal misalignment between HR and IT. IT is focused on systems, security and governance, and understandably wants data to stay inside the organisation’s own walls, managed with confidence and control. HR, meanwhile, is looking outward at what’s available in the market to build capability faster. Those two instincts often collide. As Bruce describes it, it becomes “HR versus IT” — a discussion he believes needs to happen openly, rather than stalling projects from the sidelines. The three paths organisations actually face When organisations look at building people analytics capability, they tend to land on one of two well-worn paths, each with a real trade-off. Build it yourself. Many organisations are already using tools like Power BI, often because IT has made a broader strategic decision to invest in the Microsoft ecosystem. Bringing in skilled people to build dashboards, insights and an AI layer on top is a genuinely strong option, but it takes time, and highly skilled internal resourcing. Go to a large SaaS platform. This is the other well-trodden route, and it comes with a significant catch: it means releasing your data outside the organisation to a vendor who effectively starts from scratch. Everything built internally to date gets set aside, replaced by what the SaaS platform builds within its own environment. These are strong tools in their own right, Bruce is clear on that, but they’re costly, timeframes stretch out, and getting your data fully into the platform takes a while. The third path. This is where AHA fits, not as a compromise between the two, but as a genuine middle ground. It’s delivered within weeks rather than months, at roughly a quarter of the cost of a typical SaaS implementation. Crucially, it’s built inside an organisation’s own Microsoft environment, which means IT keeps control of the data, access and governance, while HR still gets the capability and speed it’s after. As Bruce puts it, “it’s a really neat fit.” Why the big HCM vendors keep falling short It’s a question every HR leader eventually asks: what about Workday, SAP, Oracle and the other major HCM vendors? Bruce has been waiting for a genuinely good analytics solution from these players for over two decades, and he’s still waiting. Vendors like Workday have released their own tools, such as Prism, but these come at a cost and still require building capability from scratch. The core limitation is structural: HCM vendors can only do so much with the data inside their own transactional systems. If an organisation runs SAP or Workday but also holds engagement data in a platform like CultureAmp, those vendors simply can’t bring that external data in. A single, modelled, blended source of truth remains something the big suites have continued to struggle with. Where AHA is different This is precisely the gap AHA was built to close. AHA blends data from any system, HCM, recruitment, learning, engagement, and beyond, connected via API or file transfer, as long as the data can be extracted. That data is then blended and modelled within the organisation’s own environment, which does more than power dashboards and drill-to-detail reporting. It makes the data AI-ready. On top of that foundation, AHA delivers an AI overlay for predictive insight, not just flagging who’s leaving the organisation, but starting to surface why, and what factors are driving it, by drawing on data that sits across the entire employee lifecycle in one place. It’s people analytics HR can actually use, and IT can actually stand behind. People analytics you can count on. Want to see how AHA could fit inside your own Microsoft environment? Book a call with the team.
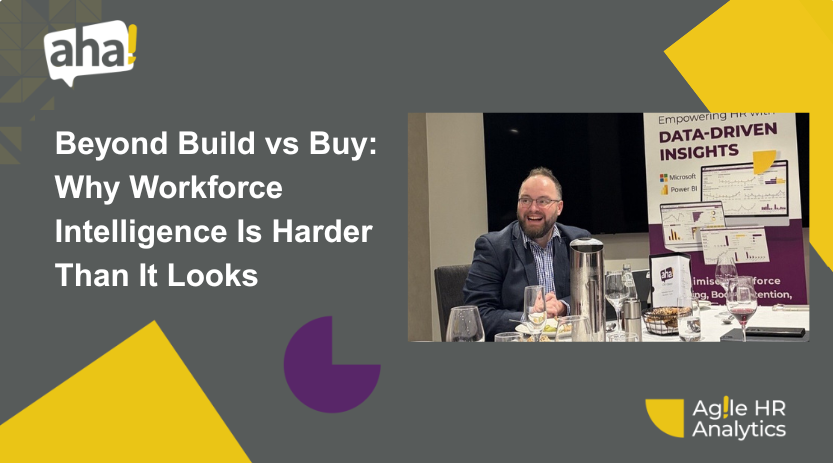
Beyond Build vs Buy: Why Workforce Intelligence Is Harder Than It Looks
AI has made it easier than ever to build dashboards, AI copilots and workforce applications. Yet many organisations still struggle to answer simple workforce questions with confidence. That paradox sat at the centre of our latest Executive Dinner in Sydney. Last week, 15 senior HR and people analytics leaders from banking, resources, insurance and telecom joined us for a private executive dinner at the Sheraton Grand Sydney Hyde Park to explore one of the most pressing questions facing CPOs right now: as AI makes it easier than ever to build your own tools, does workforce intelligence still need to be bought? Hosted by Dr Philip Gibbs, Co-Founder of Agile HR Analytics. The conversation didn’t land on a simple answer. It landed on a much more useful one. Six themes from the room The evening surfaced six recurring themes that CPOs can take straight into their own leadership meetings. Each was captured as a discussion guide for the room, under Chatham House Rule: 1. AI is exposing organisational capability Ask: Are we solving a technology problem, or revealing an organisational one? 2. Governed experimentation Ask: Have we made responsible learning easier than ungoverned workarounds? 3. Augmentation before substitution Ask: What work do we want humans to do more of? 4. Trusted data foundations Ask: Which answers must executives be able to trust immediately? 5. Leadership and psychological safety Ask: What are leaders doing that makes experimentation safe and purposeful? 6. Workforce Intelligence as enterprise capability Ask: Who owns the outcome when workforce intelligence changes a decision? The question every CPO is quietly asking For years, the pitch for workforce intelligence has gone something like this: it takes real investment, in technology, in data platforms, in governance, in specialist capability, to turn people data into something a business can actually act on. AI has upended that assumption. With modern development tools, a sharp analyst or a motivated internal team can now spin up a dashboard, an app or even an AI assistant in days, not months. So it’s no wonder Boards and CEOs are asking their CPOs a version of the same question: why are we still buying this? It’s a fair question. It’s just not the whole question. Faster interfaces don’t mean less complexity The room was clear on one thing: AI has dramatically lowered the cost of building the front end. What it hasn’t touched is the complexity underneath. People data is still one of the most nuanced, most heavily governed domains in the enterprise. A slick chatbot or dashboard sitting on top of a shaky data model doesn’t make the underlying problem go away, it just makes it harder to spot. Real workforce intelligence still depends on things AI can’t shortcut: Trusted, well-structured data models Clear workforce taxonomies Governance frameworks that actually hold up under scrutiny Regulatory compliance across jurisdictions Ethical guardrails around sensitive people data Business logic and decision architecture Deep domain expertise in HR, not just in data Several attendees pointed out that this is exactly where “quick build” projects tend to unravel, not at launch, but six months in, when the data underneath starts to crack under real use. Caught in the middle A recurring theme was just how squeezed CPOs are feeling as Digital, Data and AI capability gets centralised across the enterprise. It’s not one pressure, it’s five, all at once: The need for faster workforce insight Enterprise-wide governance requirements Technology roadmaps and delivery backlogs that don’t move at HR’s pace Pressure to show AI value quickly Rising expectations from the Board and the CEO None of these pressures are going away, and none of them cancel each other out. The organisations doing this well aren’t picking one priority over the others, they’re finding ways to move quickly within a governed structure, rather than treating speed and governance as opposing forces. What “doing it well” actually looks like A few practical threads ran through the discussion: Build on what you already trust. Several leaders in the room weren’t starting from scratch, they were extending existing data foundations and existing platform investments (Microsoft, Power BI) rather than standing up parallel, ungoverned tools. That foundation is what let them move fast without creating shadow IT problems for their Digital and Data teams to clean up later. Governance isn’t the thing slowing you down, the wrong governance is. The pitfall isn’t governance itself, it’s bolting governance on after the fact, once a tool is already in front of leaders and hard to unwind. “Build vs buy” is often the wrong framing. The more useful question several attendees landed on wasn’t whether to build or buy, but where their internal capability should sit: owning the data model, taxonomy and governance layer in-house, while leaning on specialist partners for the parts that take years to get right the first time. The clearest formulation of that idea came from the room itself, and it’s arguably the strongest insight from the evening: Build what differentiates you. Buy what doesn’t. Govern everything. Technology is getting easier. Capability is what’s hard. AI is steadily reducing the cost of building technology. What it hasn’t reduced, and arguably has raised, is the importance of organisational capability. The barrier to standing up a dashboard, a copilot or an application has never been lower. The barrier to trusting what it tells you hasn’t moved. That was, in many ways, the overarching insight of the evening: technology is becoming commoditised, while leadership, governance, data quality and organisational design are becoming the true differentiators. The organisations that treat those as afterthoughts will keep rebuilding the same tools. The ones that invest in them will build something that lasts. Where this leaves CPOs AI hasn’t made workforce intelligence easier to get right, it’s made it easier to get started, which isn’t quite the same thing. The organisations that come out ahead won’t be the ones that built the fastest prototype. They’ll be the ones that paired that speed with a data foundation, governance model and domain expertise solid
How to Build Pay Equity Analytics in Power BI for Regulated Enterprises
Introduction: Why Pay Equity Analytics Matter in Regulated Industries Pay equity has evolved from a compliance checkbox to a strategic business imperative. Regulated enterprises across financial services, healthcare, government, and technology sectors face increasing scrutiny from regulatory bodies, investors, and employees themselves. The Equal Employment Opportunity Commission (EEOC) requires organizations to maintain detailed compensation records, while the Securities and Exchange Commission (SEC) now mandates pay equity disclosures for public companies. Beyond regulatory pressure, organizations that proactively address pay equity see tangible benefits: improved talent retention, enhanced employer brand, reduced litigation risk, and better access to diverse talent pools. Building pay equity analytics in Power BI represents a modern, scalable approach to understanding and addressing compensation disparities across your workforce. Unlike static spreadsheets or manual audits, a dynamic analytics platform enables continuous monitoring, rapid identification of gaps, and data-driven remediation strategies. For regulated enterprises managing thousands or tens of thousands of employees across multiple geographies and business units, this capability is essential. Agile HR Analytics (AHA!) provides ready-to-use dashboards and pre-built data models specifically designed to accelerate this process, leveraging the Microsoft stack including Power BI, Azure, and Azure OpenAI. This guide walks you through the complete journey: from understanding regulatory requirements and preparing your data, through building sophisticated analytics and ensuring compliance, to measuring the business impact of your pay equity initiatives. Understanding Pay Equity Frameworks and Regulatory Requirements The Regulatory Landscape Regulated enterprises must navigate a complex web of pay equity requirements that vary by jurisdiction, industry, and organizational size. In the United States, the Equal Pay Act of 1963 prohibits wage discrimination based on sex, while Title VII of the Civil Rights Act of 1964 extends protections to race, color, religion, and national origin. The EEOC’s Employer Information Report (EEO-1) requires companies with 100 or more employees to report compensation data by race, ethnicity, and gender across job categories. International regulations add another layer of complexity. The European Union’s Equal Pay Directive requires member states to ensure pay transparency and equal pay for work of equal value. The UK Equality Act 2010 mandates gender pay gap reporting for organizations with 250 or more employees. Canada, Australia, and other jurisdictions have similarly stringent requirements. When you’re managing a global workforce, your analytics solution must accommodate these varied reporting standards while maintaining a unified view of compensation practices. Key Pay Equity Metrics and Definitions Before building your analytics solution, establish a shared understanding of key metrics. The gender pay gap, often the most visible metric, measures the difference in average pay between men and women. However, this raw figure can be misleading without context. Adjusted pay gap calculations control for legitimate factors like job level, tenure, performance rating, and geographic location. Equal pay analysis compares compensation for employees performing substantially similar work, while pay transparency metrics measure the visibility of salary bands and compensation criteria across the organization. Regulated enterprises should also track pay equity by additional protected characteristics: race and ethnicity, age, disability status, and veteran status. Some jurisdictions require separate analysis by these dimensions. Your analytics framework should support flexible segmentation so you can analyze pay equity across any combination of demographic groups, job families, business units, and geographic regions. Data Preparation and Integration for Pay Equity Analysis Identifying Required Data Sources Comprehensive pay equity analytics require data from multiple systems. Your Human Resources Information System (HRIS) provides employee demographics, job titles, job levels, hire dates, and employment status. Your payroll system supplies compensation data including base salary, bonuses, commissions, stock options, and benefits. Your talent management or performance system contributes performance ratings, tenure, and skill information. Organizational data defines reporting structures, job families, and business units. Survey data from engagement or compensation benchmarking studies provides market context. For regulated enterprises, data governance is paramount. Establish clear data ownership, stewardship, and quality standards. Many organizations discover that their HRIS and payroll systems contain inconsistent job classifications, incomplete demographic data, or outdated employee information. Before building analytics, conduct a comprehensive data audit. Identify missing values, standardize categorical fields (job levels, job families, departments), and establish data validation rules. This foundational work prevents flawed analysis and ensures regulatory compliance. Data Integration and Cleansing Strategies Power BI can connect to virtually any data source: SQL Server databases, Azure SQL Database, Excel files, Salesforce, Workday, SAP SuccessFactors, and hundreds of other applications. For regulated enterprises, consider your data residency requirements. Azure provides multiple geographic regions, allowing you to keep sensitive HR data within specific jurisdictions to meet GDPR, CCPA, and other privacy regulations. When integrating data, establish a single source of truth for employee identity. Use employee ID as the primary key, and create a master employee dimension that reconciles data across systems. Handle date-based changes carefully: compensation changes, promotions, and demographic updates occur throughout the year. Your data model should support point-in-time analysis so you can answer questions like “What was the pay gap on June 30th?” for regulatory reporting. Data cleansing is iterative. Create Power Query scripts that standardize job titles into consistent job families, map organizational codes to business units, and validate compensation values. Flag suspicious data (negative salaries, extreme outliers) for investigation rather than silently removing it. Document all transformations so your analysis is auditable and reproducible. Building Your Data Model in Power BI Designing a Star Schema for Pay Equity Analysis Effective Power BI analytics rest on a well-designed data model. For pay equity analysis, use a star schema with a central fact table and multiple dimension tables. Your fact table contains one row per employee per pay period or as of a specific date, with measures like base salary, total compensation, and calculated metrics like adjusted pay gap. Dimension tables include Employee (with demographic attributes, hire date, employment status), Job (job title, job family, job level, salary band), Organization (department, business unit, location, country), and Time (pay period, fiscal year, quarter). Additional dimensions might include Performance (rating, performance band), Tenure (tenure bucket, years of service), and Compensation (compensation philosophy, pay equity adjustment history). This
HR Data Integration Best Practices: Connecting Payroll, HRIS, Survey and Business Systems in Azure
Introduction: The Strategic Imperative of HR Data Integration Organizations today generate vast amounts of human resources data across disconnected systems. Payroll platforms hold compensation and benefits information, HRIS systems manage employee records and organizational hierarchies, employee surveys capture sentiment and engagement metrics, and business systems contain performance, financial, and operational context. Yet most enterprises struggle to connect these silos into a unified view that drives strategic workforce decisions. HR data integration is no longer a technical luxury reserved for large corporations with dedicated data teams. It has become a business imperative. According to recent research on HR data integration benefits and use cases, organizations that successfully integrate HR data across multiple sources report faster decision-making, improved employee experience, and stronger alignment between HR strategy and business outcomes. The challenge intensifies for enterprises operating across multiple geographies, regulatory jurisdictions, and legacy technology stacks. A global organization might run payroll in three different systems, maintain HRIS data in another platform, collect engagement surveys through a standalone tool, and store financial performance metrics in enterprise business systems. Connecting these sources while maintaining data quality, security, and compliance with regulations like GDPR and CCPA requires a thoughtful, systematic approach. This comprehensive guide walks you through the best practices, technical patterns, and organizational strategies for implementing robust HR data integration. Whether you are a CHRO evaluating enterprise HR analytics solutions, an HR data team designing integration architecture, or an IT leader assessing Azure-based deployment options, you will find actionable guidance to accelerate your data integration journey. Understanding HR Data Integration Architecture The Foundation: Why Architecture Matters Successful HR data integration begins with a clear architectural vision. Architecture defines how data flows from source systems into a central repository, how that data is transformed and enriched, and how it is made available to end users through analytics and insights platforms. Poor architecture leads to data inconsistencies, maintenance nightmares, and missed opportunities for insight. A well-designed HR data integration architecture serves multiple purposes. It provides a single source of truth for employee and organizational data, eliminates manual data reconciliation efforts, enables real-time or near-real-time analytics, supports compliance and audit requirements, and creates a foundation for AI-powered insights. When you build on solid architectural principles, you reduce technical debt, improve scalability, and make it easier to add new data sources or analytics capabilities in the future. Hub-and-Spoke vs. Centralized Data Lake Models Two primary architectural patterns dominate enterprise HR data integration: the hub-and-spoke model and the centralized data lake model. In a hub-and-spoke architecture, a central HR data hub acts as the authoritative source for employee and organizational information. Payroll systems, HRIS platforms, and other source systems connect to this hub through point-to-point integrations or APIs. The hub validates, reconciles, and distributes data to downstream systems. This model works well for organizations with a limited number of source systems and clear ownership of the central hub. However, it can become brittle as you add more systems and more complex transformation logic. A centralized data lake model, by contrast, pulls data from all source systems into a cloud-based repository (such as Azure Data Lake or Azure Fabric), applies transformations and business logic in a dedicated transformation layer, and exposes harmonized data through analytics platforms. This model scales better as you add new data sources and provides greater flexibility for complex analytics. The tradeoff is increased operational complexity and the need for robust data governance. For most enterprises, a hybrid approach works best. You establish a core HR data hub that owns the authoritative employee and organizational master data, while also building a data lake that ingests data from payroll, surveys, business systems, and other sources for advanced analytics and reporting. This hybrid model, often called a “medallion architecture” when implemented on Azure Fabric, provides both the control of a hub-and-spoke system and the flexibility of a data lake. Integration Patterns: Real-Time, Batch, and Event-Driven How frequently does data need to flow from source systems to your analytics platform? The answer depends on your use cases and the nature of the data. Batch integration works well for data that changes infrequently or where near-real-time updates are not critical. Payroll data, for example, typically changes on a monthly or bi-weekly cycle. You can batch-load payroll data into your analytics platform on a scheduled basis, validate it, and make it available for analysis. Batch integration is generally simpler to implement and maintain than real-time integration. Real-time or event-driven integration is necessary when you need insights to update as data changes. If you are tracking attrition risk and want to flag employees at risk as soon as they update their LinkedIn profile or attend an exit interview, you need event-driven integration. Similarly, if you are monitoring compensation equity and want to flag potential issues as soon as new hires or promotions occur, real-time data flows are essential. Most enterprises use a combination of batch and event-driven patterns. Core HR data flows in real-time or near-real-time as employees are hired, transferred, or separated. Payroll data flows in batch cycles aligned with pay periods. Survey data flows as responses are submitted. Business performance data flows on a schedule aligned with financial reporting cycles. This mixed approach balances the need for timely insights with the operational simplicity of batch processing where real-time is not required. Key Data Sources and Integration Priorities Payroll Systems: The Foundation of Compensation Data Payroll systems are often the richest source of employee financial data. They contain compensation details, benefits elections, tax withholdings, deductions, and payment history. Yet payroll data is often the most tightly guarded and hardest to integrate, due to security concerns and regulatory requirements around sensitive financial information. When integrating payroll data, start by identifying which payroll elements are necessary for your analytics use cases. Do you need gross pay, net pay, or both? Do you need benefits cost data? Do you need historical compensation data for trend analysis? Once you have identified your requirements, work with your payroll team and system vendor to establish secure, validated
Local Hosting and Data Privacy: Guide to Deploying People Analytics On-Premises with Microsoft Fabric
Introduction: Why On-Premises People Analytics Matters Organizations today face unprecedented pressure to make data-driven decisions about their workforce. From attrition prediction and pay equity analytics to workforce planning and talent optimization, the demand for actionable HR insights has never been greater. Yet for many enterprises, particularly those in regulated industries, the cloud-first approach to analytics comes with significant concerns around data sovereignty, compliance, and control. On-premises people analytics deployment addresses these critical concerns by keeping sensitive employee data within your organization’s infrastructure while still leveraging modern analytics capabilities. This comprehensive guide explores how to deploy people analytics solutions on-premises using Microsoft Fabric, ensuring that your HR data remains secure, compliant, and under your direct control. Agile HR Analytics (AHA!) understands these challenges intimately. Built on the Microsoft stack including Power BI, Azure, and Azure OpenAI, Agile HR Analytics delivers AI-powered HR and people insights solutions that support both cloud and on-premises deployments. Whether you’re managing a global workforce in multiple regulatory jurisdictions or operating in highly regulated industries like healthcare, financial services, or government, this guide will help you navigate the complexities of deploying people analytics infrastructure on your own terms. Understanding Data Privacy Requirements for HR Analytics The Regulatory Landscape for Employee Data Employee data represents one of the most sensitive categories of personal information your organization handles. Unlike customer data, which is often pseudonymized or aggregated, HR analytics frequently requires working with personally identifiable information (PII) including names, employee IDs, compensation details, performance ratings, and sensitive demographic information. Regulatory requirements vary significantly by geography and industry. Organizations operating in the European Union must comply with the General Data Protection Regulation (GDPR), which establishes strict requirements for lawful processing, data minimization, and individual rights. According to GDPR Principles guidance, organizations must ensure that personal data is processed lawfully, fairly, and transparently, collected for specified purposes, and kept accurate and up to date. In North America, the California Consumer Privacy Act (CCPA) and similar state-level regulations impose requirements around consumer data rights, though employee data may be treated differently depending on jurisdiction. Organizations in Canada must comply with PIPEDA (Personal Information Protection and Electronic Documents Act), while those in Australia must follow the Privacy Act and Australian Privacy Principles. Beyond geographic regulations, industry-specific requirements add additional layers of complexity. Healthcare organizations must maintain HIPAA compliance when analyzing workforce data that may intersect with patient care. Financial services firms must navigate SEC and banking regulations. Government contractors and agencies must comply with NIST standards and federal data protection requirements. Why Data Sovereignty Matters Data sovereignty refers to the principle that data is subject to the laws of the country in which it is stored. For multinational organizations, this creates significant complexity. An employee in Germany has data protection rights under GDPR regardless of where the organization’s headquarters is located. An employee in California has rights under CCPA. An employee in the UK has rights under UK GDPR and the Data Protection Act 2018. On-premises hosting allows you to maintain data sovereignty by ensuring that employee data remains within specific geographic boundaries. This is particularly important for organizations that operate across multiple jurisdictions and need to maintain separate data residency for different regions. Rather than storing all employee data in a centralized cloud environment, you can maintain separate on-premises instances or use geographically distributed infrastructure that respects local data protection requirements. Privacy by Design in People Analytics Privacy by design is a regulatory principle that requires organizations to build privacy protections into systems from the ground up, rather than adding them as an afterthought. For people analytics, this means considering data privacy at every stage of your implementation, from initial data collection and integration through analysis, visualization, and access control. This principle encompasses several key practices. Data minimization requires that you collect only the employee data actually needed for your analytics use cases. Purpose limitation means using data only for the stated purposes that employees were informed about. Storage limitation requires that you don’t retain data longer than necessary. Access control ensures that only authorized personnel can view sensitive information. And transparency means clearly communicating to employees what data you’re collecting, how you’re using it, and what protections are in place. Microsoft Fabric Architecture for On-Premises Deployments Understanding Microsoft Fabric Components Microsoft Fabric represents a unified analytics platform that integrates data engineering, data science, analytics, and business intelligence capabilities. For on-premises deployments, understanding how Fabric components work together is essential for building a secure, scalable people analytics solution. At its core, Microsoft Fabric consists of several interconnected services. Power BI provides the visualization and reporting layer, enabling business users and HR leaders to interact with dashboards and insights. Azure Data Factory handles data movement and transformation, allowing you to orchestrate complex data pipelines that integrate HR systems, payroll data, survey results, and business metrics. Synapse Analytics provides the data warehousing and big data analytics engine. Data Explorer offers rapid data exploration and ad hoc analysis capabilities. For on-premises deployments, the architecture typically involves a hybrid approach where some components run on your local infrastructure while others may leverage Azure services through private connectivity. Power BI can be deployed on-premises using Power BI Report Server, maintaining full control over the reporting and visualization layer. Data integration can occur through self-hosted integration runtimes that run within your network, ensuring that data never traverses the public internet. On-Premises Deployment Models Microsoft Fabric supports several deployment models for organizations prioritizing on-premises infrastructure. The most common approach for people analytics involves a hybrid model where data integration and processing occur on-premises using self-hosted integration runtimes, while analytical processing may leverage Azure services through private endpoints and encrypted connections. For organizations requiring complete on-premises operation, Power BI Report Server provides a fully on-premises reporting solution. This approach gives you complete control over the infrastructure, network connectivity, and data flows. All user access, authentication, and authorization can be managed through your existing Active Directory infrastructure. Backup, disaster recovery, and maintenance are entirely under your control. Alternatively, some organizations
Role-Based Access in HR Dashboards: How to Secure People Data in Power BI
Why Role-Based Access Control Matters for HR Data Human resources data represents some of the most sensitive information within any organization. Compensation details, performance ratings, health insurance information, employment history, and personal identifiers all fall under the umbrella of people data that requires careful protection. When you deploy HR dashboards across your organization using Power BI, you’re making this critical data accessible to multiple stakeholders—but each stakeholder should only see the information relevant to their role. Role-based access control (RBAC) in HR dashboards isn’t just a nice-to-have feature; it’s a fundamental security requirement. Without proper access controls, a compensation analyst might inadvertently see executive pay data, a manager could access compensation information for employees outside their department, or an HR business partner might view sensitive data from confidential investigations. These scenarios create legal liability, damage employee trust, and violate privacy regulations that govern how organizations must handle personal employee information. The stakes are particularly high in regulated industries. Organizations operating in healthcare, financial services, energy, pharmaceuticals, and government sectors face stringent data protection mandates. The General Data Protection Regulation (GDPR) in Europe, the California Consumer Privacy Act (CCPA), and industry-specific regulations like HIPAA and SOX all impose strict requirements on how organizations collect, store, process, and access personal data. Failure to implement proper access controls can result in significant fines, reputational damage, and operational disruption. Beyond compliance, RBAC enables better decision-making. When each user sees only the data relevant to their responsibilities, they can focus on actionable insights rather than getting overwhelmed by organizational-wide information. A department manager needs to understand their team’s headcount, turnover, and performance metrics—but not compensation data for other departments. An executive sponsor needs aggregate workforce trends—but not individual employee records. By implementing thoughtful role-based access, you ensure that each dashboard consumer gets the right data at the right level of granularity. Understanding Role-Based Access Control in Power BI Role-based access control in Power BI operates at multiple layers, each serving a distinct security function. Understanding these layers is essential for building a comprehensive data protection strategy that safeguards HR information while enabling legitimate business access. The Three Layers of Power BI Security Power BI’s security architecture includes workspace-level access, dataset-level permissions, and report-level filtering. The first layer, workspace security, controls who can even access a Power BI workspace where HR dashboards are stored. This is the broadest control—if a user doesn’t have access to the workspace, they can’t see any of the reports or data within it. Workspace access is managed through Azure Active Directory (AAD) groups, allowing IT administrators to use existing organizational structures to govern access. The second layer involves dataset permissions and sharing settings. Once a user has workspace access, dataset permissions determine whether they can view, edit, or share specific datasets. For HR analytics, this means you might grant dataset access to your analytics team while restricting access from general business users. This layer provides protection against unauthorized modifications to your data models and prevents accidental or intentional data exposure through dataset exploration. The third and most granular layer is report-level security, which includes Row-Level Security (RLS) and Object-Level Security (OLS). This is where you implement the sophisticated filtering that ensures each user sees only the data appropriate for their role. According to Microsoft’s official guidance on Power BI implementation planning for report consumer security, this layer is critical for controlling access to sensitive metrics and employee records based on user identity and organizational context. Row-Level Security (RLS) Fundamentals Row-Level Security is the primary mechanism for filtering data in Power BI based on user identity. RLS works by applying DAX (Data Analysis Expressions) filters to tables in your Power BI data model. These filters automatically restrict which rows of data each user can see when they view a report or dashboard. Consider a practical example in HR analytics. You have an employee table with columns for Employee ID, Name, Department, Salary, and Performance Rating. Without RLS, any user who accesses this data can see every employee’s complete record. With RLS, you can create a role that filters the employee table to show only employees in the Finance department. When a Finance manager views a dashboard, the underlying data is automatically filtered to show only their department’s employees. RLS operates through a combination of security roles and DAX expressions. You define security roles in Power BI Desktop, then apply DAX filters to tables within each role. The DAX expression evaluates the current user’s identity (obtained from Azure AD) and applies the appropriate filter. For example, a DAX expression might look like: [Department] = USERNAME() or [Manager_ID] = USERPRINCIPALNAME(). When the report is published to Power BI Service and accessed by users, these filters execute automatically based on each user’s identity. Object-Level Security (OLS) for Enhanced Control While RLS filters rows of data, Object-Level Security controls access to specific columns and measures. This is valuable in HR analytics where you might want different user groups to see different metrics. For instance, you could hide the “Salary” column from general managers while showing it to compensation specialists. OLS allows you to restrict visibility of sensitive columns at the object level, providing an additional layer of protection. According to industry research on role-based access control in enterprise analytics, implementing both RLS and OLS creates a robust security framework that addresses multiple threat vectors. RLS protects against unauthorized access to specific employee records, while OLS prevents exposure of sensitive metrics that certain users shouldn’t see. HR Data Security Challenges and Compliance Requirements Implementing role-based access in HR dashboards requires understanding the unique security challenges that HR data presents and the regulatory landscape that governs its protection. Unique Challenges of HR Data Security HR data is fundamentally different from other business data because it’s deeply personal and highly regulated. An employee’s compensation, health information, performance history, and personal identifiers all carry significant privacy implications. Unlike sales data or financial metrics, HR data directly impacts individuals’ livelihoods and privacy. One major challenge is the distributed nature of
Using Azure OpenAI for Sensitive HR Queries: Practical Guide for CHROs
Introduction: The Convergence of AI and HR Data Security In today’s rapidly evolving workplace, Chief Human Resources Officers (CHROs) face an unprecedented challenge: harnessing the power of artificial intelligence to unlock insights from HR data while maintaining the highest standards of security, privacy, and compliance. The emergence of large language models and AI-powered assistants has created exciting opportunities for HR teams to ask complex questions about workforce dynamics, compensation equity, talent retention, and organizational performance, driven by advances from providers such as OpenAI (https://openai.com/). However, these opportunities come with significant responsibilities, particularly when dealing with sensitive employee information. The intersection of Azure OpenAI and HR analytics represents a transformative opportunity for enterprises seeking to derive actionable intelligence from their people data. Unlike generic AI solutions, Azure OpenAI provides organizations with a secure, enterprise-grade foundation for building intelligent HR systems that respect data privacy, maintain regulatory compliance, and deliver rapid insights; see Microsoft’s Azure OpenAI Service documentation for technical details (https://learn.microsoft.com/azure/cognitive-services/openai/). For CHROs and their teams, understanding how to leverage this technology responsibly is no longer optional but essential for competitive advantage. For broader cloud and platform considerations, review Microsoft’s Azure platform overview (https://azure.microsoft.com/) and industry analyst perspectives from firms like Gartner (https://www.gartner.com/). According to recent industry research, organizations that implement AI-powered HR analytics experience a 23% improvement in hiring quality and a 17% reduction in employee turnover. However, these benefits only materialize when the underlying infrastructure prioritizes security and compliance from the ground up. This guide provides CHROs, HR leaders, and technical teams with a comprehensive roadmap for implementing Azure OpenAI-based solutions that handle sensitive HR queries securely and effectively. For HR best practices and guidance on change management, see resources from SHRM (https://www.shrm.org/) and CIPD (https://www.cipd.co.uk/). Understanding Azure OpenAI in the HR Context What Makes Azure OpenAI Different from Standard OpenAI Azure OpenAI represents Microsoft’s enterprise-grade implementation of OpenAI’s powerful language models, specifically designed for organizations with stringent security, compliance, and data residency requirements. Unlike the standard OpenAI API, Azure OpenAI operates within your own Azure tenant, providing complete control over data flow, retention policies, and access patterns. For HR professionals, this distinction is critical. When you submit a sensitive HR query to standard OpenAI, your data travels through OpenAI’s infrastructure and may be retained for model improvement purposes. Azure OpenAI, by contrast, ensures that your HR data remains within your organization’s Azure environment. This architectural difference fundamentally changes what’s possible in terms of security and compliance. The platform leverages Microsoft’s extensive experience with enterprise security, having served organizations across highly regulated industries including healthcare, finance, and government for decades. Azure OpenAI integrates seamlessly with other Microsoft services like Power BI (https://powerbi.microsoft.com/), Azure SQL Database (https://azure.microsoft.com/services/sql-database/), and Azure Data Lake (https://azure.microsoft.com/services/storage/data-lake-storage/), creating a cohesive ecosystem that HR teams can leverage immediately. Core Capabilities for HR Analytics Azure OpenAI provides several capabilities that are particularly valuable for HR analytics and workforce insights. The natural language processing capabilities allow HR teams to query complex datasets using conversational language rather than SQL or complex dashboard navigation. For instance, a CHRO can ask “What is our pay equity gap by department and gender?” and receive a comprehensive analysis with supporting data visualizations. The platform also excels at summarization and synthesis of large HR datasets. When your organization has surveys, performance reviews, exit interviews, and organizational data spanning multiple systems, Azure OpenAI can help identify patterns, synthesize insights, and highlight anomalies that might otherwise remain hidden in spreadsheets and databases. Another critical capability is contextual understanding. Unlike simple keyword matching or basic analytics queries, Azure OpenAI understands nuance and context. It can distinguish between different types of attrition, understand compensation structures across multiple geographies, and provide insights that account for industry benchmarks and organizational context. For benchmarking and market data to enrich these insights, many organizations use third-party datasets and consultancies such as McKinsey (https://www.mckinsey.com/) or Deloitte (https://www2.deloitte.com/). Security and Compliance Foundations for Sensitive HR Data The Regulatory Landscape for HR Data Before implementing any AI-powered HR solution, CHROs must understand the regulatory frameworks governing employee data in their jurisdictions. The General Data Protection Regulation (GDPR) in Europe (https://gdpr.eu/), the California Consumer Privacy Act (CCPA) in the United States (https://oag.ca.gov/privacy/ccpa), and similar regulations globally impose strict requirements on how organizations collect, process, and store employee information. These regulations typically require that organizations implement data minimization principles, meaning you should only collect and process data that’s necessary for legitimate business purposes. When implementing Azure OpenAI for HR queries, this principle becomes even more important because you’re creating an additional processing layer that must be accounted for in your data governance framework. According to the International Association of Privacy Professionals (https://iapp.org/), organizations that fail to properly implement privacy controls face penalties averaging $4.24 million per incident. For CHROs, this isn’t merely a compliance issue but a fundamental business risk that impacts organizational reputation, employee trust, and shareholder value. In heavily regulated sectors, compliance with standards such as HIPAA (https://www.hhs.gov/hipaa/index.html) for health data or ISO/IEC 27001 (https://www.iso.org/isoiec-27001-information-security.html) for information security frameworks may also apply. Data Classification and Sensitivity Levels The first step in securing HR queries is establishing a clear data classification system. Not all HR data carries the same sensitivity level. While organizational structure and job titles might be relatively low-sensitivity, compensation data, performance ratings, health information, and background check results are highly sensitive and require elevated protection. Implementing a data classification framework helps your organization determine what controls are appropriate for different types of information. A common approach uses four tiers: public, internal, confidential, and restricted. Most HR data falls into the confidential or restricted categories, requiring encryption both in transit and at rest, limited access based on business need, and audit trails documenting who accessed what information and when. When implementing Azure OpenAI for HR queries, ensure that your classification system explicitly addresses AI-processed data. Some organizations require additional controls when sensitive data is processed by AI systems, such as requiring human review before insights are shared or limiting the retention period
Optimizing HR Data Pipelines in Azure Data Factory for People Analytics
Introduction In today’s data-driven organization, HR leaders and analytics teams face an unprecedented challenge: transforming vast amounts of employee, payroll, talent, and organizational data into actionable insights that drive strategic decisions. The ability to build, maintain, and optimize data pipelines is no longer a technical nicety—it’s a competitive necessity. Azure Data Factory (ADF) has emerged as a powerful orchestration platform for building enterprise-grade data pipelines, particularly for HR and people analytics use cases. However, simply deploying ADF is not enough. Organizations must understand how to architect, optimize, and secure these pipelines to unlock the full potential of their HR data. This comprehensive guide explores the strategies, best practices, and technical approaches required to optimize HR data pipelines in Azure Data Factory. Whether you’re a CHRO evaluating analytics platforms, a data engineer implementing complex integrations, or an IT leader assessing security and compliance requirements, you’ll find actionable guidance tailored to the unique challenges of HR data management. Understanding HR Data Pipelines and Their Strategic Importance What Are HR Data Pipelines? An HR data pipeline is an automated workflow that extracts, transforms, and loads (ETL) data from multiple HR, payroll, survey, and business systems into a centralized analytics environment. Unlike traditional IT data pipelines focused on operational efficiency, HR data pipelines must balance speed, accuracy, privacy, and compliance with the nuanced requirements of workforce analytics. HR data pipelines typically integrate data from: HRIS systems (SAP SuccessFactors, Workday, ADP, BambooHR) Payroll platforms (ADP Payroll, Paychex, Kronos) Survey tools (Qualtrics, Culture Amp, engagement surveys) Business systems (Salesforce, ERP, finance systems) External data sources (labor market benchmarks, economic indicators) Once consolidated, this data feeds into analytics dashboards, predictive models, and AI-powered insights that inform decisions about hiring, retention, compensation, workforce planning, and organizational health. Strategic Value of Optimized HR Data Pipelines According to The Strategic Power of HR Data Analytics, organizations with mature HR analytics capabilities report measurably better outcomes in retention prediction, talent optimization, and workforce performance. Optimized data pipelines are the foundation enabling these outcomes. When HR data pipelines are properly designed and optimized, they deliver: Faster insights: Real-time or near-real-time access to workforce metrics enables rapid decision-making Higher data quality: Automated validation and cleansing reduce errors and inconsistencies Reduced costs: Efficient data movement and processing minimize cloud infrastructure spending Improved compliance: Automated governance and audit trails support regulatory requirements Scalability: Well-architected pipelines grow with your organization without performance degradation Azure Data Factory Fundamentals for HR Data Integration Why Azure Data Factory for HR Analytics? Azure Data Factory is a cloud-native, code-free data integration service that excels at orchestrating complex, multi-source HR data workflows. Key advantages for HR analytics include: No-code/low-code design: Business analysts and HR data teams can build pipelines without extensive coding Native Azure integration: Seamless connectivity with Azure SQL Database, Azure Data Lake, and Synapse Analytics Microsoft stack alignment: Direct integration with Power BI, Azure OpenAI, and Microsoft Fabric for advanced analytics Enterprise security: Managed Identity, Key Vault integration, and role-based access control (RBAC) Cost optimization: Pay-per-activity pricing model encourages efficient pipeline design For organizations using platforms like Agile HR Analytics, Azure Data Factory serves as the backbone for rapid deployment of pre-built HR data models and dashboards. Core ADF Concepts for HR Pipelines Pipelines and Activities: A pipeline is a logical grouping of activities (copy, transform, execute) that accomplish a specific data workflow. For HR data, a typical pipeline might extract employee records from your HRIS, validate against payroll data, and load into your analytics warehouse. Linked Services: These define connections to data sources (SAP SuccessFactors, Workday, SQL Server, Azure storage). For HR systems, linked services must securely store credentials and support appropriate authentication methods. Datasets: Datasets represent the structure and location of data within a linked service. An HR dataset might define the schema of an employee master file or payroll transaction table. Integration Runtimes: These are the compute environments where activities execute. For HR data pipelines, choosing the right integration runtime (cloud-based or self-hosted) impacts performance, security, and compliance. Setting Up Your First HR Data Pipeline Following Best Practices for Implementing Azure Data Factory, your initial HR pipeline should include: Source connection: Establish a secure linked service to your HRIS or payroll system Data validation: Add lookup or conditional activities to verify data completeness and quality Transformation logic: Use Data Flow or Stored Procedures to apply business rules (e.g., calculating tenure, normalizing job titles) Destination loading: Copy transformed data to your analytics database or data lake Error handling: Implement retry logic and failure notifications Logging: Capture pipeline execution details for troubleshooting and compliance auditing Designing Scalable Data Pipelines for People Analytics Architecture Patterns for Multi-Source HR Data As organizations grow, so does the complexity of their HR data landscape. A scalable pipeline architecture must accommodate multiple source systems, varying data frequencies, and evolving business requirements. The Hub-and-Spoke Model: This pattern uses Azure Data Factory as the central hub, with separate spokes for each HR source system (HRIS, payroll, survey, business data). Each spoke has its own extraction and validation logic, feeding into a common staging layer. This approach isolates source-specific complexity while enabling consistent transformation downstream. The Medallion Architecture: Data progresses through three layers: Bronze (raw, unmodified data from sources), Silver (cleaned, deduplicated, validated data), and Gold (business-ready, aggregated analytics data). This layered approach, discussed in Designing Scalable Data Pipelines for People Analytics, enables incremental transformation and supports different consumer needs (data scientists need Silver; business users need Gold). Real-Time Streaming for High-Velocity Data: Some HR metrics (shift times, real-time headcount) benefit from streaming ingestion. Azure Data Factory can trigger on schedule or event, feeding streaming data into Event Hubs or Kafka topics for immediate analytics. Handling Schema Evolution and Data Quality HR data is notoriously prone to schema changes. When your HRIS vendor releases an update, new fields appear. When your organization restructures, hierarchies shift. Scalable pipelines must handle these changes gracefully. Implement schema detection and validation by: Using parameterized datasets: Define column names and types as parameters, allowing a single pipeline to handle
Predicting Attrition with Pre-built Data Models: Implementation Guide for People Analytics Teams
Introduction: Why Attrition Prediction Matters Employee attrition represents one of the most significant financial and operational challenges facing modern organizations. When a key employee leaves, organizations face not only the direct costs of recruitment, onboarding, and training but also the hidden costs of lost productivity, institutional knowledge, and team disruption. For enterprise organizations operating across multiple geographies and regulated industries, these costs can reach hundreds of thousands of dollars per departure. The challenge intensifies when attrition occurs unexpectedly. Reactive hiring strategies consume resources that could be invested in retention initiatives, while sudden departures disrupt project timelines and damage team morale. However, modern people analytics has transformed attrition from an inevitable mystery into a predictable phenomenon that organizations can anticipate and address proactively. Predictive analytics for employee attrition leverages historical HR data, behavioral patterns, and machine learning algorithms to identify employees at risk of leaving before they submit their resignation. This shift from reactive to proactive management enables HR leaders and CHROs to implement targeted retention strategies, improve workforce planning, and ultimately reduce turnover costs. The adoption of attrition prediction models has become increasingly critical for talent leaders. Organizations that implement predictive attrition analytics report significant improvements in retention rates, better succession planning, and more strategic allocation of compensation and development resources. Yet many organizations struggle with implementation complexity, data integration challenges, and the technical expertise required to build and maintain custom machine learning models. This is where pre-built data models and AI-powered platforms like Agile HR Analytics fundamentally change the equation. By providing ready-to-use models built on proven machine learning architectures, organizations can deploy attrition prediction capabilities in weeks rather than months, without requiring advanced data science expertise. Understanding Attrition Prediction Models How Machine Learning Identifies At-Risk Employees Attrition prediction relies on machine learning classification algorithms that learn patterns from historical employee data. The fundamental principle is straightforward: by analyzing the characteristics and behaviors of employees who have previously left your organization, machine learning models can identify current employees who exhibit similar patterns and are therefore at elevated risk of departure. Research published in peer-reviewed journals demonstrates the effectiveness of these approaches. A systematic review of 58 studies on machine learning for turnover prediction confirms that Random Forest algorithms consistently outperform other methods, while studies on integrating machine learning and explainable AI for employee attrition prediction identify job satisfaction and stock options as key predictive variables. Additionally, <a href=”https://laccei.org/LACCEI2024-CostaRica/papers/Contribution498final_a.pdf”>research comparing ML models for attrition prediction shows that XGBoost and Random Forest achieve accuracy rates exceeding 98%, demonstrating the reliability of these approaches when properly implemented. The process works through several stages. First, the algorithm ingests historical data about employees who have left your organization, including their tenure, compensation, department, performance ratings, engagement scores, and dozens of other variables. The algorithm then identifies patterns in this data that correlate with departure. For example, it might discover that employees in certain departments with below-average engagement scores and limited career progression opportunities are significantly more likely to leave within the next 12 months. Once trained on historical data, the model can then be applied to your current employee population. Each active employee receives a risk score reflecting the probability that they will leave within a specified timeframe, typically 6 to 12 months. Employees clustered in the high-risk category become candidates for targeted retention interventions. Why Pre-built Models Accelerate Time-to-Value Building a custom attrition prediction model from scratch requires significant technical resources. Data scientists must source and clean data from multiple systems, perform exploratory data analysis, select appropriate algorithms, tune hyperparameters, validate results, and establish ongoing monitoring processes. For organizations without dedicated data science teams, this process can take 6 to 12 months, if it happens at all. Pre-built data models fundamentally compress this timeline. Rather than starting from zero, organizations begin with a model architecture that has been validated across thousands of employees and refined through continuous improvement. These models come pre-configured with the most relevant variables, optimal algorithm selection, and proven thresholds for risk classification. The Agile HR Analytics platform offers ready-to-use dashboards and pre-built data models designed specifically for HR analytics use cases, including attrition prediction. By leveraging these pre-built models, organizations can deploy prediction capabilities in weeks, allowing HR teams to begin acting on insights immediately rather than waiting for custom model development. Key Machine Learning Algorithms for Attrition Prediction Multiple machine learning algorithms have proven effective for attrition prediction, each with distinct advantages. Research on classification models in scikit-learn provides detailed guidance on implementing these algorithms, while peer-reviewed articles on predictive analytics for employee attrition highlight job satisfaction and work-life balance as critical determinants across multiple approaches. Random Forest algorithms consistently deliver the highest accuracy rates, often exceeding 98% in controlled studies. These ensemble methods work by creating multiple decision trees and averaging their predictions, which reduces overfitting and improves generalization to new data. Random Forest also provides feature importance scores that help identify which variables most strongly predict attrition. XGBoost represents another high-performing option, particularly effective for datasets with complex variable interactions. This gradient boosting algorithm sequentially improves predictions by learning from previous errors, and it often matches or exceeds Random Forest performance while requiring less computational resources. Logistic Regression, while simpler, remains valuable for organizations prioritizing model interpretability. This linear approach produces probability estimates directly interpretable by non-technical stakeholders and requires less data than ensemble methods to achieve reasonable accuracy. Support Vector Machines (SVM) excel at finding optimal boundaries between at-risk and stable employees, particularly in high-dimensional datasets with many variables. Research on SVM approaches for attrition prediction demonstrates their effectiveness, while studies applying multiple models in the tech industry show Random Forest achieving 85% accuracy across diverse organizational contexts. The choice of algorithm depends on your organization’s priorities. If maximum accuracy is paramount and your team has data science expertise, Random Forest or XGBoost are optimal. If interpretability and stakeholder buy-in are priorities, Logistic Regression or simpler tree-based models may be preferable. The advantage of pre-built models in platforms like Agile HR Analytics is
Customising Pre-built People Analytics Models for Global Enterprises
Introduction Global enterprises today operate across multiple regions, jurisdictions, and regulatory frameworks, each with unique workforce dynamics, compensation structures, and compliance requirements. The challenge isn’t simply having HR data—it’s transforming that data into actionable insights that drive strategic decisions across geographically dispersed teams. This is where customising pre-built people analytics models becomes essential. Pre-built analytics models offer a significant advantage: they provide proven frameworks, data structures, and visualization patterns that have been validated across multiple organizations. Rather than building from scratch, global enterprises can accelerate their time-to-value by starting with industry-standard models and then tailoring them to their specific operational needs. However, the true power emerges when these models are thoughtfully customized to reflect your organization’s unique structure, regional variations, and strategic priorities. This comprehensive guide walks you through the entire process of customising pre-built people analytics models for global enterprises. Whether you’re evaluating solutions like those offered at https://www.agile-hr-analytics.com/ or implementing across your existing Microsoft stack, you’ll discover practical strategies to maximize the value of your HR analytics investment while maintaining security, compliance, and organizational alignment. Understanding Pre-built People Analytics Models What Are Pre-built People Analytics Models? Pre-built people analytics models are templated data structures, calculations, and visualizations designed to address common HR analytics use cases. Rather than developing metrics from scratch, these models provide standardized approaches to measuring workforce dimensions such as headcount, attrition, engagement, compensation equity, and talent pipeline health. These models typically include: Data schemas that organize HR, payroll, and business data into logical relationships Calculated metrics such as turnover rates, time-to-hire, and retention indices Dashboard templates with pre-configured visualizations for common stakeholder views Dimension hierarchies (organization, geography, role, tenure) that enable drill-down analysis Predefined KPIs aligned with industry benchmarks and best practices According to research on 4 People Analytics Operating Models To Implement, organizations that start with pre-built frameworks reduce implementation timelines by 40-60% compared to custom-built solutions. This acceleration is particularly valuable for global enterprises where time-to-insight directly impacts competitive advantage. Why Pre-built Models Matter for Global Organizations Global enterprises face distinct challenges that pre-built models help address. First, they provide consistency: a unified approach to calculating metrics like headcount, attrition, and cost-per-hire across all regions ensures comparable data and reduces confusion when stakeholders in different countries review the same metric. Second, pre-built models embed industry best practices. Rather than reinventing analytical approaches, your team benefits from patterns that have been tested and refined across hundreds of organizations. This is especially important for sophisticated analyses like pay equity assessment and attrition prediction, where methodological rigor matters significantly. Third, they accelerate deployment. Global enterprises often operate under time pressure to deliver insights quickly. Pre-built models allow you to move from data integration to actionable dashboards in weeks rather than months, enabling faster decision-making at the executive level. The Business Case for Customization Why One Size Doesn’t Fit All While pre-built models provide tremendous value, they are inherently generic. They reflect industry averages and common use cases, not your organization’s unique structure, strategy, and operating model. Customisation transforms these generic models into strategic assets that directly support your business priorities. Consider a global pharmaceutical company with R&D centers in the US and Europe, manufacturing facilities in Asia, and sales operations across all regions. A pre-built headcount model might show total employees by geography and function. But the company’s strategic priority is understanding the ratio of research scientists to manufacturing technicians, retention patterns of high-potential researchers, and cost-per-hire variations across skill markets. Without customization, the pre-built model provides data but not insight. With thoughtful customization, it becomes a strategic tool that directly answers the questions driving business decisions. Quantifying the Value of Customization Research from People Analytics: Use Cases, Frameworks & How to Start demonstrates that organizations that customize analytics models to their specific business context achieve: 25-35% faster decision-making in talent acquisition and retention initiatives 15-20% improvement in hiring quality by customizing recruitment funnel metrics 10-15% reduction in unwanted attrition through targeted retention analytics 8-12% improvement in compensation equity by customizing pay equity analysis to regional market rates For a global enterprise with 10,000+ employees, these improvements translate to millions in value. Faster hiring decisions reduce time-to-productivity. Better retention reduces replacement costs. Improved compensation equity reduces legal and reputational risk. Assessing Your Current HR Data Landscape Conducting a Data Readiness Assessment Before customizing any pre-built model, you must understand the quality, completeness, and accessibility of your HR data. This foundational step determines what customizations are feasible and what data preparation work is required. Begin with a comprehensive inventory of all HR data sources across your global organization. This includes: HRIS systems (primary employee record systems, often region-specific) Payroll systems (which may vary by country due to tax and regulatory requirements) Time and attendance systems (tracking working hours and leave) Recruitment systems (ATS platforms tracking hiring pipelines) Learning management systems (training and development data) Survey platforms (engagement, pulse, and feedback data) Business systems (ERP, CRM, financial systems containing role, cost center, and revenue data) For each source, document: Data completeness: What percentage of records have valid values for key fields? Data accuracy: How frequently is data updated, and how is data quality monitored? Data consistency: Are definitions (e.g., “active employee”, “manager”) consistent across systems? Access and security: What are the authentication and authorization requirements? Latency: How current is the data, and what refresh frequency is required? Many global enterprises discover significant inconsistencies during this assessment. For example, one region might define “manager” as anyone with direct reports, while another includes individual contributors with mentoring responsibilities. These definitional gaps must be resolved before building analytics. Identifying Data Integration Challenges Global organizations often operate multiple HRIS instances, each with different data structures. A US subsidiary might use one system, a European operation another, and an Asia-Pacific region a third. Integrating these systems into a unified analytics platform is technically and organizationally complex. Key challenges include: System heterogeneity: Different platforms, data models, and field definitions Time zone and calendar differences: Fiscal years, pay periods, and reporting cycles vary by

Workforce Planning with Power BI: Scenario Modelling and Forecasting Guide
Introduction to Workforce Planning and Power BI Workforce planning has evolved from a static, annual exercise into a dynamic, data-driven discipline that shapes organizational strategy. Today’s HR leaders face unprecedented complexity: shifting labor markets, rapid technological change, evolving workforce preferences, and the need to make decisions faster than ever before. Power BI has emerged as a critical tool for transforming raw HR data into actionable intelligence that drives smarter workforce decisions. The convergence of advanced analytics, artificial intelligence, and business intelligence platforms has fundamentally changed how organizations approach workforce planning. Rather than relying on spreadsheets and historical trends, modern workforce planners use scenario modeling and forecasting to explore multiple future states, test assumptions, and build resilience into their talent strategies. According to research from McKinsey on how AI is reshaping workforce planning, organizations that leverage predictive analytics and scenario modeling are 23% more likely to outperform their peers in talent acquisition and retention. This guide explores how to harness Power BI’s capabilities to build sophisticated workforce planning models that provide competitive advantage. Power BI’s integration with the broader Microsoft ecosystem, including Azure and Azure OpenAI, creates a powerful foundation for workforce analytics. When combined with purpose-built HR analytics solutions like Agile HR Analytics, organizations can accelerate their time to insight while maintaining security and governance standards that regulated industries demand. Understanding the Fundamentals of Scenario Modeling What Is Scenario Modeling in Workforce Planning? Scenario modeling is a strategic planning technique that explores multiple potential futures based on different assumptions and variables. Rather than forecasting a single “most likely” outcome, scenario modeling creates a range of plausible futures, each built on distinct assumptions about business conditions, market dynamics, and organizational decisions. In the context of workforce planning, scenario modeling allows HR leaders to ask critical questions: What if we expand into three new markets? What happens to our headcount if attrition increases by 15%? How does our compensation strategy perform under different revenue scenarios? By building these scenarios into Power BI dashboards, organizations can stress-test their workforce strategies and prepare contingency plans. The power of scenario modeling lies in its ability to move beyond prediction and into exploration. Rather than asking “What will happen?” organizations ask “What could happen, and how should we respond?” This shift in perspective creates organizational agility and reduces the risk of workforce strategy misalignment. Key Scenario Types for Workforce Planning Effective workforce planning typically involves building three to five core scenarios. The most common framework includes: Optimistic scenarios assume favorable business conditions, revenue growth, market expansion, and successful talent acquisition. These scenarios help organizations identify the skills and capacity they need to capture growth opportunities. They answer questions about recruitment timelines, training needs, and compensation adjustments required to attract top talent. Base case scenarios represent the most likely future based on current trends and reasonable assumptions. These scenarios serve as the primary planning baseline and inform annual budgets, headcount plans, and resource allocation decisions. The base case should be grounded in historical data and validated by business leaders. Pessimistic scenarios explore challenging conditions including economic downturns, market disruption, increased competition for talent, or organizational setbacks. These scenarios are essential for building workforce resilience and ensuring organizations can navigate uncertainty without catastrophic talent loss. Additional specialized scenarios might include restructuring scenarios that model the impact of organizational changes, technology adoption scenarios that forecast the impact of automation on skill requirements, or market-specific scenarios that reflect regional variations in labor availability and costs. Building Scenario Assumptions The quality of your scenario modeling depends entirely on the quality of your assumptions. Poor assumptions lead to misleading forecasts, regardless of how sophisticated your analytical methods are. Effective assumptions should be: Data-driven, grounded in historical trends and validated by external research. Rather than guessing at attrition rates, pull your actual attrition data from your HRIS and validate against industry benchmarks. Documented and transparent, so stakeholders understand the logic behind each scenario. When building scenarios in Power BI, include assumption cards or tables that clearly state the attrition rate, revenue growth rate, hiring velocity, and other key variables driving each scenario. Flexible and updatable, allowing you to adjust assumptions as new information becomes available. Build your Power BI models with assumption parameters that can be easily modified without rebuilding the entire model. Challenged and validated by business leaders across finance, operations, and HR. The best scenarios emerge from cross-functional collaboration where each function brings its perspective on what’s likely and what matters most. Data Integration and Preparation for Forecasting The Foundation: Quality HR Data Power BI’s analytical power is only as good as the data flowing into it. Workforce planning requires integrating data from multiple sources: your HRIS system (employee records, organizational structure, job codes), payroll system (compensation, benefits, cost center allocations), applicant tracking system (hiring pipeline, time-to-hire), and business systems (revenue, headcount budgets, departmental plans). The Human Resources sample for Power BI from Microsoft provides a foundational dataset and tour for workforce analytics, demonstrating how to structure HR data for effective analysis. This sample includes employee demographics, performance metrics, and organizational hierarchy data that forms the basis for workforce forecasting. Data quality issues are common in HR environments. Employee records may contain duplicate entries, outdated information, or inconsistent job classifications. Payroll data might have gaps during system transitions. Applicant tracking systems often contain incomplete historical hiring data. Before building forecasting models, invest time in data cleaning and validation: Validate employee counts against your HRIS system of record. Reconcile active employees, separations, and transfers to ensure your dataset accurately represents your workforce at each point in time. Standardize job codes and classifications across systems. Many organizations have multiple job classification schemes that must be mapped to a single taxonomy for meaningful analysis. Clean demographic data including location, department, manager, and tenure. Use data profiling tools to identify missing values, outliers, and inconsistencies. Reconcile compensation data across payroll systems. Ensure base salary, bonus, and benefits data align with your authoritative payroll records. Integrating Multiple Data Sources Modern workforce planning requires pulling

Guide to Measuring Pay Equity with HR Dashboards and Power BI Models
Table of Contents Introduction: Why Pay Equity Measurement Matters Understanding Pay Equity in the Modern Workplace The Role of HR Dashboards in Pay Equity Analysis Building a Strong Data Foundation Power BI Models for Pay Equity Measurement Key Metrics and KPIs for Tracking Pay Equity Implementing Real-Time Monitoring Best Practices and Governance Case Studies and Practical Applications Getting Started with Your Organization Introduction: Why Pay Equity Measurement Matters {#introduction} Pay equity has evolved from a compliance checkbox to a strategic imperative for organizations worldwide. In an era where talent retention, employer reputation, and regulatory scrutiny are at unprecedented levels, the ability to measure, analyze, and act on compensation disparities is no longer optional. Organizations that fail to address pay equity risks face significant consequences: talent attrition, legal exposure, reputational damage, and diminished ability to attract top performers. The challenge, however, is that pay equity measurement requires more than good intentions. It demands sophisticated data analysis, robust visualization capabilities, and the ability to integrate disparate HR, payroll, and business systems. This is where modern HR analytics platforms and Power BI models become indispensable tools. According to research from the Society for Human Resource Management on measuring pay equity with data tools, organizations that implement data-driven pay equity programs see measurable improvements in retention, engagement, and organizational trust. The same research indicates that companies using advanced analytics to monitor compensation are 40% more likely to identify and correct pay inequities before they escalate into legal or cultural issues. This comprehensive guide walks you through the entire process of measuring pay equity using HR dashboards and Power BI models. Whether you’re a CHRO evaluating enterprise solutions, a compensation manager tasked with equity audits, or a data analyst building your organization’s first pay equity dashboard, you’ll find actionable strategies, technical guidance, and best practices to transform raw compensation data into meaningful, equitable outcomes. Understanding Pay Equity in the Modern Workplace {#understanding-pay-equity} Defining Pay Equity vs. Equal Pay Before diving into measurement approaches, it’s essential to clarify terminology. Many organizations conflate pay equity with equal pay, but these concepts, while related, are distinct. Equal pay refers to the principle that employees performing substantially the same work should receive the same compensation. This concept is enshrined in laws like the Equal Pay Act of 1963 in the United States and similar legislation globally. Equal pay focuses on job-to-job comparisons within a narrow scope. Pay equity, by contrast, is broader. It encompasses the principle that compensation should be fair and non-discriminatory across the entire organization, accounting for differences in job responsibilities, experience, performance, and market conditions. Pay equity analysis examines whether pay differences are justified by legitimate business factors or whether they reflect systemic bias based on protected characteristics such as gender, race, ethnicity, or age. Understanding this distinction is critical because it shapes how you design your measurement framework. A pay equity analysis will examine compensation across diverse job categories, departments, and levels, looking for unexplained variances that might indicate bias. The Business and Regulatory Landscape The regulatory environment surrounding pay equity continues to tighten. The U.S. Department of Labor’s guidance on compensation transparency and pay equity analysis methods outlines federal expectations for organizations to proactively audit and address pay disparities. In the European Union, GDPR compliance combined with increasing pay transparency regulations means organizations must maintain robust, auditable records of compensation decisions. Beyond compliance, there’s a compelling business case. Organizations that demonstrate commitment to pay equity experience lower turnover, higher engagement, improved recruitment outcomes, and reduced legal risk. In competitive talent markets, pay equity is increasingly a differentiator in employer branding. Common Pay Equity Challenges Most organizations struggle with pay equity measurement for several reasons: Data fragmentation is the first obstacle. Compensation data lives in multiple systems: payroll, HRIS, benefits platforms, and performance management tools. Bringing this data together in a unified, clean format is technically challenging and organizationally complex. Methodological complexity is the second. Determining what constitutes a “legitimate business factor” for pay differences requires statistical sophistication. Simple averages and percentages can mask important patterns or create false positives. Proper analysis requires regression modeling, statistical significance testing, and careful variable selection. The third challenge is organizational readiness. Pay equity analysis often surfaces uncomfortable truths about historical hiring, promotion, and compensation practices. Organizations must be prepared to act on findings, which requires executive commitment, transparent communication, and sometimes difficult organizational changes. Modern HR analytics platforms and Power BI models help organizations overcome these challenges by automating data integration, providing statistical rigor, and enabling transparent, data-driven conversations about compensation. The Role of HR Dashboards in Pay Equity Analysis {#role-of-dashboards} Why Dashboards Are Essential for Pay Equity HR dashboards serve multiple critical functions in pay equity measurement. First, they democratize access to compensation data. Rather than requiring specialized statistical expertise to understand pay patterns, well-designed dashboards present complex analyses in intuitive visual formats that senior leaders, compensation professionals, and HR business partners can understand and act upon. Second, dashboards enable continuous monitoring rather than episodic audits. Historical approaches to pay equity involved annual or biennial audits, which meant organizations operated with stale data and delayed responses to emerging issues. Modern dashboards provide real-time visibility into compensation patterns, allowing organizations to identify and address issues as they emerge. Third, dashboards facilitate transparent communication. When pay equity findings are presented through dashboards that stakeholders can explore themselves, it reduces defensiveness and increases buy-in for corrective actions. Leaders can drill down into data, understand the drivers of any identified disparities, and make informed decisions about remediation. According to Gartner’s research on HR dashboard best practices for compensation equity, organizations that implement comprehensive compensation dashboards are significantly more likely to achieve sustained pay equity improvements, as these tools enable faster decision-making cycles and better coordination between compensation, talent acquisition, and workforce planning functions. Key Components of an Effective Pay Equity Dashboard An effective pay equity dashboard should include several core components: Compensation overview metrics provide the foundation: average salary, median salary, 25th and 75th percentile salaries, and total compensation (including

Guide to implementing predictive attrition dashboards for enterprise HR
Table of Contents Introduction: The Strategic Imperative of Predictive Attrition Dashboards Understanding Predictive Attrition and Its Business Impact Building Your Data Foundation for Attrition Prediction Designing Effective Predictive Attrition Dashboards Implementing Machine Learning Models for Attrition Forecasting Integrating Data Sources and Ensuring Data Quality Creating Actionable Insights for Retention Strategies Security, Compliance, and Governance Considerations Measuring ROI and Success Metrics Best Practices and Common Pitfalls Conclusion and Next Steps Introduction: The Strategic Imperative of Predictive Attrition Dashboards {#introduction} Employee attrition represents one of the most significant financial and operational challenges facing enterprise organizations today. The cost of replacing a single employee can range from 50% to 200% of their annual salary when accounting for recruitment, onboarding, lost productivity, and institutional knowledge. For large enterprises managing thousands of employees across multiple regions, unplanned turnover can translate into millions of dollars in annual losses. Traditional HR approaches rely on reactive measures, identifying attrition only after employees have already departed. By contrast, predictive attrition dashboards leverage advanced analytics and machine learning to identify employees at risk of leaving before it happens. This shift from reactive to proactive management enables HR leaders to implement targeted retention strategies, preserve institutional knowledge, and maintain organizational stability. Predictive attrition dashboards are not simply reporting tools; they represent a fundamental transformation in how enterprises approach workforce planning and talent management. By combining historical HR data, real-time performance metrics, and behavioral signals, these dashboards provide CHROs, talent managers, and HR analytics teams with the intelligence needed to make data-driven retention decisions. This comprehensive guide walks you through every aspect of implementing predictive attrition dashboards in an enterprise environment. Whether you’re evaluating solutions like those offered by Agile HR Analytics or building custom implementations on the Microsoft stack, you’ll learn the strategic, technical, and operational considerations required for success. Understanding Predictive Attrition and Its Business Impact {#understanding-attrition} What Is Predictive Attrition? Predictive attrition refers to the use of statistical models and machine learning algorithms to forecast which employees are most likely to leave an organization within a specific timeframe (typically 3, 6, or 12 months). These models analyze historical patterns from employees who have left and apply those patterns to current employee populations to generate risk scores. Unlike simple turnover metrics that show you how many people left last quarter, predictive attrition models answer the critical question: who is at risk of leaving next? This forward-looking perspective enables proactive intervention before valuable talent walks out the door. Research on explainable attrition risk scoring for managerial retention decisions demonstrates that when HR leaders have access to transparent, interpretable attrition risk scores, they can make more informed retention decisions and allocate resources more effectively to high-risk populations. The Business Case for Attrition Prediction The financial impact of implementing predictive attrition dashboards extends far beyond simple cost avoidance. Organizations that successfully implement these systems report: Reduced turnover costs: By identifying and retaining at-risk employees before departure, organizations can save millions annually in replacement costs Improved talent retention: Targeted retention programs for high-risk employees increase success rates compared to generic retention initiatives Better workforce planning: Predictive insights enable more accurate succession planning and hiring forecasts Enhanced employee engagement: Proactive outreach to at-risk employees often improves overall engagement scores Preserved institutional knowledge: Retaining experienced employees protects critical business knowledge and client relationships Improved leadership effectiveness: Managers equipped with attrition risk data can have more targeted conversations with their teams For enterprise organizations, the cumulative impact is substantial. A company with 10,000 employees experiencing 15% annual turnover saves approximately $15-30 million annually by reducing turnover by just 2-3 percentage points through effective attrition prediction and retention programs. Key Drivers of Employee Attrition Effective predictive models must account for the multiple factors that drive attrition decisions. These typically include: Compensation and benefits: Salary competitiveness, bonus structures, and benefits packages significantly influence retention Career development: Limited advancement opportunities and lack of learning and development investments increase attrition risk Management quality: Poor manager relationships and ineffective leadership are among the top reasons employees leave Work environment: Company culture, remote work flexibility, and work-life balance directly impact retention Role fit and engagement: Misalignment between employee skills and role requirements creates dissatisfaction Tenure and tenure patterns: Employees within specific tenure windows (e.g., 2-3 years) often face higher attrition Performance and potential: High performers and high-potential employees may have more external opportunities Organizational changes: Restructuring, mergers, and leadership changes increase attrition risk Successful predictive attrition dashboards integrate data about these drivers to build comprehensive risk profiles. Technical guidance on <a href=”https://www.kbr.com/sites/default/files/documents/2023-09/7892AIArnoldHumanResourcesDatato_Predict.pdf”>using human resources data to predict when your best employees will leave highlights how machine learning models can synthesize multiple data sources to identify nuanced attrition patterns that human analysts might miss. Building Your Data Foundation for Attrition Prediction {#data-foundation} Identifying Required Data Sources The quality and comprehensiveness of your data directly determines the accuracy and utility of your predictive models. Enterprise implementations typically require data from multiple systems: HRIS data: Employee demographics, tenure, job titles, departments, compensation, benefits enrollment, and employment status Payroll data: Salary history, bonus payments, benefits costs, and compensation changes Performance management: Performance ratings, review comments, promotion history, and disciplinary records Learning and development: Training completion, course enrollment, certification achievements, and skill assessments Engagement surveys: Employee engagement scores, pulse survey responses, and sentiment indicators Attendance and leave: Absence patterns, leave usage, and scheduling data Recruitment and internal mobility: Internal transfer history, external applications, and promotion patterns Business performance: Departmental metrics, project assignments, and business outcomes Organizational structure: Reporting relationships, team composition, and organizational changes The most sophisticated implementations, like those enabled by Agile HR Analytics, integrate data from multiple HR and business systems into unified data models that enable comprehensive analysis while maintaining data security and privacy. Data Integration and Consolidation Most enterprises maintain HR data across multiple systems: HRIS platforms like Workday or SuccessFactors, payroll systems, ATS platforms, and learning management systems. Consolidating this data into a single analytical environment is essential but complex. Effective data integration requires: Master data management: Establishing a single source of

What Is an HR Dashboard and How It Drives People Decisions
Understanding HR Dashboards: The Foundation of Data-Driven People Decisions In today’s fast-moving business environment, HR leaders face an unprecedented challenge: making strategic decisions about their workforce while drowning in data scattered across multiple systems. An HR dashboard serves as a centralized intelligence hub that consolidates workforce information into visual, interactive displays designed specifically for human resources decision-making. Rather than manually combing through spreadsheets or generating static reports, HR professionals can now access real-time insights that illuminate trends, highlight risks, and reveal opportunities within their organization. At its core, an HR dashboard is a business intelligence tool for tracking HR KPIs with interactive data exploration, enabling leaders to monitor critical workforce metrics at a glance. Think of it as the control center for your people strategy, where every chart, gauge, and data point tells a story about your organization’s human capital. Whether you’re tracking recruitment velocity, monitoring attrition patterns, analyzing compensation equity, or forecasting workforce needs, a well-designed HR dashboard transforms raw data into actionable intelligence that drives faster, more confident decisions. The evolution of HR dashboards reflects a broader shift in how organizations view human resources. No longer confined to administrative functions, modern HR has become a strategic business partner. This transformation depends critically on the ability to measure, analyze, and act on people-related data. HR metrics dashboards consolidate workforce data into visual charts and KPI cards for real-time monitoring, allowing CHROs and senior HR leaders to move beyond gut-feel decisions toward evidence-based strategies that directly impact organizational performance and employee experience. The Core Components of an Effective HR Dashboard Understanding what makes an HR dashboard effective requires examining its essential building blocks. Each component serves a specific purpose in translating complex workforce data into clear, actionable insights. Data Integration and Consolidation The foundation of any powerful HR dashboard lies in its ability to pull data from multiple sources and unify it into a coherent picture. Modern organizations typically store HR information across numerous systems: HRIS platforms, payroll systems, applicant tracking systems (ATS), survey tools, learning management systems (LMS), and business intelligence platforms. A robust HR dashboard integrates all these data streams seamlessly. This integration challenge is particularly acute for enterprise organizations with complex IT environments. Agile HR Analytics addresses this through pre-built data models and connectors that work across the Microsoft stack, including Power BI, Azure, and Azure OpenAI. By consolidating HR data, payroll information, survey responses, and business metrics into a unified platform, organizations eliminate data silos that previously prevented holistic workforce analysis. Without proper data consolidation, HR teams waste valuable time reconciling numbers from different systems or worse, making decisions based on incomplete information. A centralized dashboard ensures that all stakeholders reference the same data sources, eliminating confusion and creating alignment around workforce metrics. Interactive Visualization and Real-Time Metrics Data is only useful if people can understand it quickly. Interactive visualizations transform complex datasets into intuitive visual formats that even non-technical users can interpret instantly. HR dashboards organize workforce data visually to track, analyze, and report on critical KPIs, enabling executives to spot trends and anomalies without requiring data science expertise. Real-time metrics represent a critical advancement over traditional static reports. Rather than waiting days or weeks for monthly reports, HR leaders can now monitor key metrics continuously. This real-time visibility enables rapid response to emerging issues. For example, if attrition spikes unexpectedly in a critical department, HR can identify the problem immediately rather than discovering it in next month’s report. Modern dashboards employ various visualization techniques: Trend lines that show metric movement over time, revealing whether attrition is improving or deteriorating Heat maps that highlight geographic or departmental problem areas requiring attention Gauge charts that show performance against targets or benchmarks Waterfall charts that break down how metrics changed from one period to the next Scatter plots that reveal correlations between variables, such as the relationship between engagement scores and retention rates Drill-Down Capability and Contextual Analysis Executives need the ability to zoom in from high-level summaries to granular details. An effective HR dashboard provides drill-down functionality that allows users to start with company-wide metrics and progressively explore data by department, location, job level, tenure, or any other relevant dimension. This contextual analysis capability transforms dashboards from reporting tools into discovery tools. A CHRO might notice that overall voluntary turnover is 12 percent but then drill down to discover that engineering is experiencing 22 percent attrition while sales remains at 8 percent. This insight immediately directs attention to where the problem actually exists, enabling targeted interventions rather than company-wide solutions that may not address the root issue. Role-Based Access and Data Governance In regulated industries and large enterprises, controlling who sees what data is essential. Agile HR Analytics emphasizes role-based access controls (RBAC) that ensure sensitive information remains protected while enabling appropriate stakeholders to access relevant insights. A compensation manager might see pay equity analytics, while a department manager might see only team-level headcount and performance data. Proper data governance protects privacy, maintains compliance with regulations like GDPR and CCPA, and ensures data quality. Modern HR dashboards built on platforms like Power BI and Azure include sophisticated access controls that prevent unauthorized data exposure while maintaining the flexibility needed for collaborative analysis. Key HR Metrics and KPIs That Drive Decision-Making While every organization’s dashboard should reflect its unique strategic priorities, certain HR metrics appear universally important for data-driven people decisions. Recruitment and Talent Acquisition Metrics HR dashboards provide visual overviews of turnover, labor costs, and recruitment metrics for strategic decision-making, helping organizations optimize their talent acquisition processes. Critical recruitment metrics include: Time-to-hire: Measures the number of days from job posting to offer acceptance. Lengthy hiring cycles damage competitiveness and increase the risk of losing top candidates to competitors. Cost-per-hire: Tracks the total investment required to fill each position, including recruiter salaries, job board fees, and interview coordination costs. This metric helps organizations optimize recruiting spend and identify whether outsourcing might be cost-effective. Application-to-hire conversion rate: Shows what percentage of applicants ultimately become employees, revealing the